|
GDP and GNI
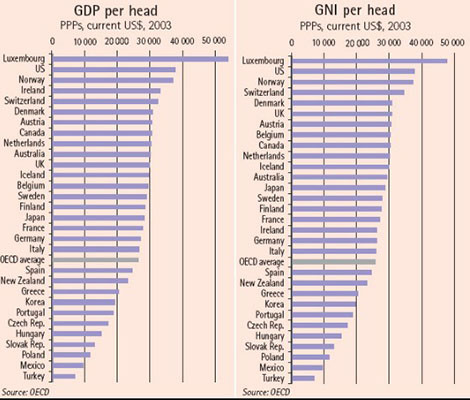
GDP is a perfect example of the muddle that reading league tables can cause. This is a relatively straightforward measure of output and gives an idea of how well-off a country is, compared with competitors and past performance. But it has to be handled carefully.
Take Luxembourg’s GDP per head (see chart). It has been at the top of the OECD rankings for several years now, well ahead of other countries, including the US. To explain the large lead, statisticians point to the 90,000-strong labour force commuting across the border everyday from Germany, France, Belgium and the Netherlands, often to work in lucrative financial services. These workers are not counted as part of Luxembourg’s population of 450,000. If they were added to this number, then overall GDP per head would be smaller, though still among the highest in the OECD.
For comparing income between countries, purchasing power differences must be taken into account. After all, as anyone that travels knows, $100 in one country can go a lot further than the same $100 in another. Consider Japan’s GDP per head, which in current market dollars at normal exchange rates lies comfortably inside the top ten in the OECD area. But when purchasing power parities (PPPs) are applied, Japan’s GDP per head slides back to 16th.
Ireland is another country where GDP has to be read with care. Ireland's position has risen up the GDP per head rankings since 1999, and is now in the top five countries in the OECD (see chart).This remarkable transformation has been put down to a mix of factors, of which inward investment in high value-added businesses is one. But does GDP per head accurately reflects Ireland’s actual wealth, since all that inward investment (and foreign labour) generates profits and other revenues, some of which inevitably flows back to the countries of origin?
Another measure, Gross National Income, accounts for these flows in and out of the country. For many countries, the flows tend to balance out, leaving little difference between GDP and GNI. But not so for Ireland, as outflows of profits and income, largely from global business giants located there, often exceed income flows back into the country. This means that in a GNI ranking, rather than being in the top five, Ireland drops to 17th. In other words, while Ireland produces a lot of income per inhabitant, GNI shows that less of it stays in the country than GDP might suggest. Japan’s GNI rank, in contrast, is a little higher than it is for GDP, at 13th, reflecting the effect of strong net financial inflows from firms and workers based abroad.
Ireland remains one of the OECD’s fastest growing economies, and this shows in a sharp rise in real income since the mid-1990s. Compared with 21 OECD countries for which figures adjusted both for inflation and purchasing power differences are available, Ireland’s GDP per capita swung from about 12% below average in 1995 to 22% above the average in 2003. GNI per capita moved from about 20% below average of the same 21 countries in 1995 to a less pronounced 4% above average, which is still quite a leap.
Of course, the statistical value of ranking can be diminished if, as in these graphs, several countries are bunched together. While ranking can help gauge performance, the choice of benchmark and its meaning must be clear. RJC
Further detailed results will be available in the forthcoming OECD publication, Purchasing Power Parities and Real Expenditures: 2002 Results.
©OECD Observer No 246/247, December 2004-January 2005, for original printed version, go to OECD iLibrary edition here
